Abstract
Background. Oral dissolving films are portable dosage forms that consist of active pharmaceutical ingredients incorporated into film-forming polymers such as starch. Starches obtain optimum filmogenic properties by gelatinization and blending with other polymers. The high starch content of bitter yam (Dioscorea dumetorum Pax) gives it yet unexplored potential for orodispersible films.
Objectives. This study aimed to investigate the effect of pregelatinization on the physicochemical properties of bitter yam starch. Additionally, our objective was to evaluate the potential of both native starch (NS) and pregelatinized starch (PS), incorporated into polymer blends, as biopolymeric materials for use in orally dissolving films (ODFs).
Materials and methods. Native and pregelatinized wild Dioscorea dumetorum Pax (bitter yam) starch were prepared and characterized using physicochemical, microscopic and rheological methods, Fourier-transform infrared spectroscopy, X-ray diffractometry (XRD), and differential scanning calorimetry (DSC). Oral dissolving films with varying hydroxylpropylmethyl cellulose (HPMC)-to-starch ratios (1:1, 1:2 and 2:1) were formulated and evaluated based on organoleptic properties, surface morphology, folding endurance, weight and thickness, pH, and disintegration time.
Results. Pregelatinization improved the swelling, solubility and hydration capacity of the starch. Although no changes were observed in the crystalline nature upon gelatinization, DSC analysis revealed remarkable changes in the thermal behavior of the NS after pregelatinization. Both NS and PS did not produce continuous films without HPMC. Flexibility of the starch increased with increasing HPMC concentration films, and PS-based films had higher folding endurance compared to NS films. Native starch-based films had smoother surfaces and higher thicknesses than PS films. All the starch films demonstrated disintegration times longer than 15 min, and slightly acidic pH values.
Conclusions. Pregelatinization of bitter yam starch, followed by blending with HPMC at a 2:1 ratio, resulted in the most effective oral film formulation. Further studies focusing on optimizing disintegration rates and pH would help confirm the suitability of this starch for use in ODF formulations.
Key words: starch pregelatinization, bitter yam, orodispersible films, film formers
Background
As the most abundant polysaccharide and the 2nd most abundant renewable polymer in nature, starch is a biopolymer that has found vast applications in several industries.1,2 Starch is utilized in the manufacturing of food, textiles, paper, and cosmetics as an adhesive, thickening, stabilizing, and gelling agent. In the pharmaceutical industry, starch is considered to be in the top 10% of excipients used in drug formulations as a multifunctional excipient in tablet formulations as a binder, disintegrant, filler, and/or lubricant.3,4
Dioscorea dumetorum Pax (bitter yam) is one of the most economically valuable species in the Dioscorea genus and Dioscoreaceae family.5 It typically has white or lemon-colored tubers. The wild form is sometimes used as animal poison when mixed with bait.5 Although the tubers from edible or wild varieties are usually boiled before consumption, the wild-type tubers have to be soaked in running water for several days after cutting to remove toxic or bitter compounds.6 In past studies, bitter yam starch has been modified by acetylation and pregelatinization to improve it tableting properties.6,7
Native starches (NS) have limited application potential in the pharmaceutical industry due to poor thermal stability, high brittleness, high viscosity, and poor solubility.7 As such, they have to be modified to improve their functional properties. Pregelatinization is achieved by a combination of heating and mechanical shearing activities, followed by drying and grinding. The resultant modified starch has higher cold-water solubility and swellability, thickening/gelling capabilities, and improved flowability.8 Consequently, pregelatinized starches (PS) are widely utilized in the pharmaceutical industry as a multifunctional versatile excipient, functioning as a binder, disintegrant and filler in formulations.9
Oral dissolving films (ODFs) are small flat dosage forms made from hydrophilic polymers that incorporate active pharmaceutical ingredients. They are designed to dissolve in the mouth and release drugs rapidly within 60 s without chewing.10 Their large surface area and thin design facilitate rapid disintegration, drug release and absorption through the oral mucosa. This allows for direct systemic absorption, bypassing pre-systemic metabolism and gastrointestinal degradation. Additionally, they offer convenience for patients who experience difficulty swallowing.10,11
Polymers serve as film formers for ODFs and provide the mechanical strength required for film integrity.11 Various native and modified starches, as well as gums, have been utilized in the formulation of films for drugs such as diclofenac,12 chlorpheniramine,13,14 amlodipine,15 buspirone hydrochloride,16 and even plant extracts like Zingiber officinale (ginger).17 To function effectively as film formers in ODFs, starches must be gelatinized and plasticized to develop suitable filmogenic properties, an effect that can also be achieved by blending them with other polymers.15
Objectives
Although extensive studies have been carried out on the suitability of various starch forms as biopolymers for oral dissolving films, the suitability of starches from bitter yam remains largely unexplored. In this study, we identify the effect of pregelatinization on the physical, chemical and pasting properties of bitter yam starch. We further investigate the applicability of both starch forms in hydroxylpropylmethyl cellulose (HPMC)-starch blends as film formers for oral dissolving films.
Materials and methods
Materials
The major materials used include tubers of bitter yam (sourced from Aawe, Oyo Town, Nigeria), sodium hydroxide, and hydrochloric acid (BDH Chemicals Limited, Poole, UK), sodium chloride (BDH Chemicals Limited) and distilled water (Department of Pharmaceutics and Industrial Pharmacy Laboratory, University of Ibadan, Nigeria). The phosphate buffers were prepared from 2 packages containing disodium hydrogen phosphate dehydrate and potassium dihydrogen phosphate (BDH Chemical Limited).
Methods
Collection of bitter yam and extraction of starch
The tubers were washed, peeled and cut into smaller sizes using a knife. The cut pieces were soaked in distilled water for 48 h and milled using a local grinding machine. The formed slurry was strained through a muslin cloth and the filtrate was left to stand for 24 h. The sediment was washed twice daily for 4 days with distilled water and the remaining residue was dried to a constant weight at 50˚C in a hot-air oven (Gallenkamp BS 250 size 1; Gallenkamp Labs, London, UK). The dried flakes were milled using a laboratory mill (Panasonic MX-AC400; Panasonic, Tokyo, Japan) and passed through a sieve of pore size of 250 µm.18
Pregelatinization of bitter yam starch
Quantities (100 g) of NS were dispersed in 100 mL of distilled water and heated at 55°C with slow constant stirring for 10 min. The resultant starch pastes were spread into thin films on clean ceramic tile and dried in a hot-air laboratory oven (TT-9083; Techmel & Techmel Ltd, Onitsha, Nigeria) at 60°C for 24 h. After this, the dried flakes were comminuted using a laboratory mill (Panasonic MX-AC400; Panasonic) and screened through a sieve of pore size of 250 µm.19,4
Characterization of the starches
Particle size and morphology
Samples of the starches were thinly spread on microscope slides of a digital microscope (VJ-2005 DN model Bio-microscope®; WanTong Precision Instruments, Wuhan, China) and examined at ×400 magnification. The particle diameters of 100 particles were measured using TS View CX Image® software (v. 6.2.4.3) and Motic Image 2000 (Motic China Group Co., Ltd., Xiamen, China). The mean particle size and standard deviation (SD) for each starch were determined using GraphPad Prism v. 8.0.1 (GraphPad Software, San Diego, USA) and recorded.
Determination of pH
Starch dispersions of 1.0%, 2.5%, 5.0%, 7.5%, and 10.0% w/v concentrations were prepared and allowed to hydrate for 2 h. The pH values of the dispersions were measured with a pH meter (FiveEasy FP20-Meter; Mettler-Toledo GmbH, Greifensee, Switzerland).4,18
Determination of solubility in water
Quantities (1.0 g) of starch were dispersed in 15 mL of distilled water, stirred for 5 min, and then heated at around 80°C on a steam bath with constant stirring. The slurry was transferred to a centrifuge tube and distilled water was added to make up to 30 mL. The mixture was separated with a centrifuge (Biobase TDL-50 Electric Centrifuge; Biobase Group, Jinan, China) at 4,000 rpm for 20 min, and the supernatant was decanted into a weighed glass petri dish (w2) and dried in a hot-air oven (Techmel and Techmel TT-9083; Techmel & Techmel Ltd) to a constant weight (w3) at 100°C. The percent solubility was calculated using the following formula19:
Determination of moisture content
Two grams (2 g) samples of each starch were separately weighed and placed on the weighing balance/heating plate of an infrared moisture analyzer (MX-50; A&D, Wood Dale, USA) and dried till their weights were constant. The determination was done in triplicates.18
Determination of swelling capacity
Ten-gram (10 g) quantities of NS and PS were weighed into clean 100-mL measuring cylinders and their tapped volumes (Va) were determined and recorded. Subsequently, the starches were dispersed in 50 mL quantities of the media solutions (distilled water, 0.1 M hydrochloric acid (HCl), pH 6.8 phosphate-buffered saline (PBS) and pH 7.4 phosphate buffer); next, the volumes were made up to 100 mL with the respective solvents. The cylinders were sealed and left to stand on the shelf for 24 h, after which the volumes of the sediments (Vb) were measured. The swelling indices of the starches in the mediums were calculated with the formula4:
Determination of hydration capacity
One gram quantities of the starch powders were transferred into pre-weighed 50 mL centrifuge tubes (w₁), and the tubes were reweighed to determine the total weight (w₂). Ten milliliters of distilled water were added to the tube, which was then shaken for 2 min and allowed to stand for 10 min, with intermittent shaking at the 5-min and 10-min marks. The samples in tubes were centrifuged at 4,000 rpm for 10 min, after which the supernatant was carefully to leave the sediment and the tube was weighed again (w2). The hydration capacity was calculated as the percentage ratio of sediment weight (w2–w1) to the dry starch weight5:
Determination of particle density
A clean, empty 50-mL pycnometer bottle was weighed (w), then completely filled with xylene in a well-ventilated area and sealed with its lid; any excess liquid was carefully wiped off. The pycnometer with its content was weighed again (w1). A 5 g quantity of the starch was weighed (w3) into the pycnometer. The excess xylene was wiped off and the bottle was re-weighed (w4). The particle density was calculated using the equation below20:
Determination of bulk density, tapped density and porosity
Bulk density of each starch sample was determined by pouring 10 g of starch into a 100-mL graduated cylinder (25 mm in diameter) through a short-stemmed glass funnel positioned at a 45° angle. The height reached by the powder was measured and the volume was calculated. In measuring the tapped density (ρt), the starch sample in the measuring cylinder was subjected to 100 taps at a metronome-controlled pace of 38 taps per minute from a height of 2.54 cm. The resultant height was measured and used to calculate the tapped volume. The bulk density (ρb) and tapped density (ρt) were calculated as the ratios of the mass of starch to the respective volumes calculated.7,21 The formulas used in calculating the volume and density are stated below:
,
where:
r – radius of the measuring cylinder;
h – height of the sample in the measuring cylinder.
The powder porosity (e) was further calculated using the equation below22:
Determination of angle of repose
A 5 g quantity of starch powder was weighed and allowed to flow freely through a funnel under the influence of gravity into an open-ended cylinder with a known diameter, positioned on a cork base resting on a horizontal surface. The height of the conical heap formed was measured and used with dimension of the cylinder to calculate the angle of repose (θ), using the formula below23:
,
where: h – height of powder heap;
r – radius of the open-ended cylinder used.
Determination of Hausner ratio and compressibility index
The Hausner ratio of each starch density determination was calculated as ratio of the tapped density (ρt) to the bulk density (ρb), while the Carr compressibility index was calculated using the equation below21:
Pasting properties of the starches
The pasting properties of the NS and PS were determined using a heating and cooling viscometer (Rapid Visco Analyzer (RVA) model Super 4; Newport Scientific, Warriewood, Australia), and viscosity profile in the form of an amylograph was generated using Thermocline for Windows (Newport Scientific).4 Three-gram (3 g) samples of each starch type were dispersed in 30 mL of water within the sample holding can, using the RVA paddle for mixing. Each analysis ran for 13 min; the stirring speed was set at 960 rpm for the first 8 s, after which it was maintained at 160 rpms for the rest of the analysis. The temperature was initially set to 50°C and held for 1 min, then gradually increased to 95°C over 3 min. It was maintained at 95°C for 4 min, then reduced back to 50°C over another 3 min, and held at 50°C for the final 2 min.24 Viscoamylographs were generated and used to determine various pasting parameters, including peak viscosity, final viscosity, setback viscosity, breakdown viscosity, and
peak temperature.18
Fourier transform infrared spectroscopy
The Fourier transform infrared (FT-IR) spectra were obtained at room temperature using an FT-IR spectrophotometer (PerkinElmer SpectrumTwo UATR Two; PerkinElmer, Waltham, USA) with the attenuated total reflection (ATR) mode.25 Minute starch powder samples were loaded onto the diamond crystal sample stage, pressed using the apparatus clamp, and analyzed at a resolution of 4 cm–1 across the wavelength range of 400–4,000 cm–1.
X-ray diffractometry
The analysis was done at ambient temperature using an X-ray diffractometer (Rigaku Miniflex 600; Rigaku, Tokyo, Japan). The samples were finely homogenized and compressed into a flat, smooth surface in the flat sample holder, and mounted on the sample stage. The samples were analyzed using on the reflection–transmission spinner stage at the theta–theta settings. The equipment was operated at an accelerating potential of 30 kV and a current of 40 mA, using a programmable divergent slit with a 5 mm-wide mask and a gonio scan. The diffraction angle (2????) ranged from 3° to 70°, with a step size of 0.02° and a dwell time of 1.0 s per step. A CuKα radiation was generated by the anode and the intensity of diffracted X-rays was continuously recorded as the sample and detector rotated through their respective angles. Using Origin software v. 6.0 (Microcal Software Inc., Northampton, USA), the results (diffractograms) were presented as X–Y plots of peak positions at 2θ vs X-ray intensity (counts).18
Differential scanning calorimetry
Thermal analysis of the starches was done using a Differential Scanning Calorimeter (Mettler-Toledo DSC; Mettler-Toledo, Columbus, USA). Sample quantities were weighed into hermetic aluminum pans and sealed tightly, while a tightly sealed empty pan was used as the reference. Both pans were placed in their allocated slots in the calorimeter. The nitrogen gas tank was turned on and maintained at a pressure of 20 psi and flow rate of 50 mL/min. Under nitrogen gas atmosphere, the sample and reference pans were heated at a rate of 10°C/min from 35°C to 250°C. Differential thermograms of the starch samples, reflecting their thermal responses, were generated using STARe SW 13.00 software (Mettler-Toledo). The differential thermograms were normalized to the mass of starches used for the analysis.
Formulation of ODFs of the starches
Blends of NS and PS with hydroxypropyl methylcellulose (HPMC) were prepared in 5 different ratios (1:0, 1:1, 1:2, 2:1, and 0:1) using a mortar and pestle. Three grams of each polymer, both starch and starch–polymer blends, were individually dispersed in 30 mL of distilled water and stirred using a magnetic stirrer (Bante Instruments MS300; Bante Instruments, Shanghai, China) at 400 rpm. Subsequently, 0.3 mL of glycerol was added to each mixture. The resulting solutions were further stirred for 10 min. The final solutions were poured into clean Petri dishes and left to stand overnight to remove bubbles. Afterward, the Petri dishes were dried in a laboratory oven (TT-9083; Techmel & Techmel) at 60°C for 24 h. The films were carefully removed from the plates, cut into intact 2 × 2 cm pieces, and stored in an airtight container.15 Table 1 shows the formulae of the oral dissolving films.
Evaluation of oral dissolving films of the starches
Organoleptic test
The organoleptic properties of film samples were evaluated by visually observing their color, texture and transparency.17 The surface textures of the films were examined by rubbing the films between a clean thumb and index finger.15
Evaluation of surface morphology
The surface morphology of the films was examined using a light microscope (Zeiss Axioskop 40; Carl Zeiss AG, Oberkochen, Germany) fitted with a digital camera (Canon PowerShot A620; Canon, Tokyo, Japan), which was used to take photomicrographs. Cut samples of 1 × 1 cm were placed on microscope slides using a forceps and viewed at ×10 magnification.
Determination of weight and thickness variation
Five films from each batch of films were weighed and the mean weight of each batch was calculated; the deviation from the mean was determined as the weight variation.14 The thickness of sample films was measured using a digital micrometer screw gauge at the 4 corners and the center of the films.16
Determination of film pH
Cut samples from each formulation batch were dissolved in 10 mL of distilled water and the pH was determined using a pH meter (FiveEasy FP20-Meter; Mettler-Toledo).14
Determination of the folding endurance
Film strips from each batch were repeatedly folded at the same point across a 180° angle until they broke; the number of folds endured before breakage was recorded as the folding endurance value.16
In vitro disintegration test
Selected films from each batch were cut into 1 × 1 cm samples and placed on 2 mL of water in a Petri dish. The average time taken for 3 films from each batch to completely disintegrate was determined as the disintegration time for the entire batch.15
Statistical analyses
Determinations were done in triplicates; the average and standard deviation values were calculated. Data obtained from the various studies were subjected to statistical analysis via Students’ t-test and analysis of variance (ANOVA) at p < 0.05 significance limit using GraphPad
Prism 8.0.1 (GraphPad Software).
Results
The results of the characterization of these formulations are summarized in Table 2 and presented in this section.
Characterization of native and pregelatinized starches
Particle size, and morphology
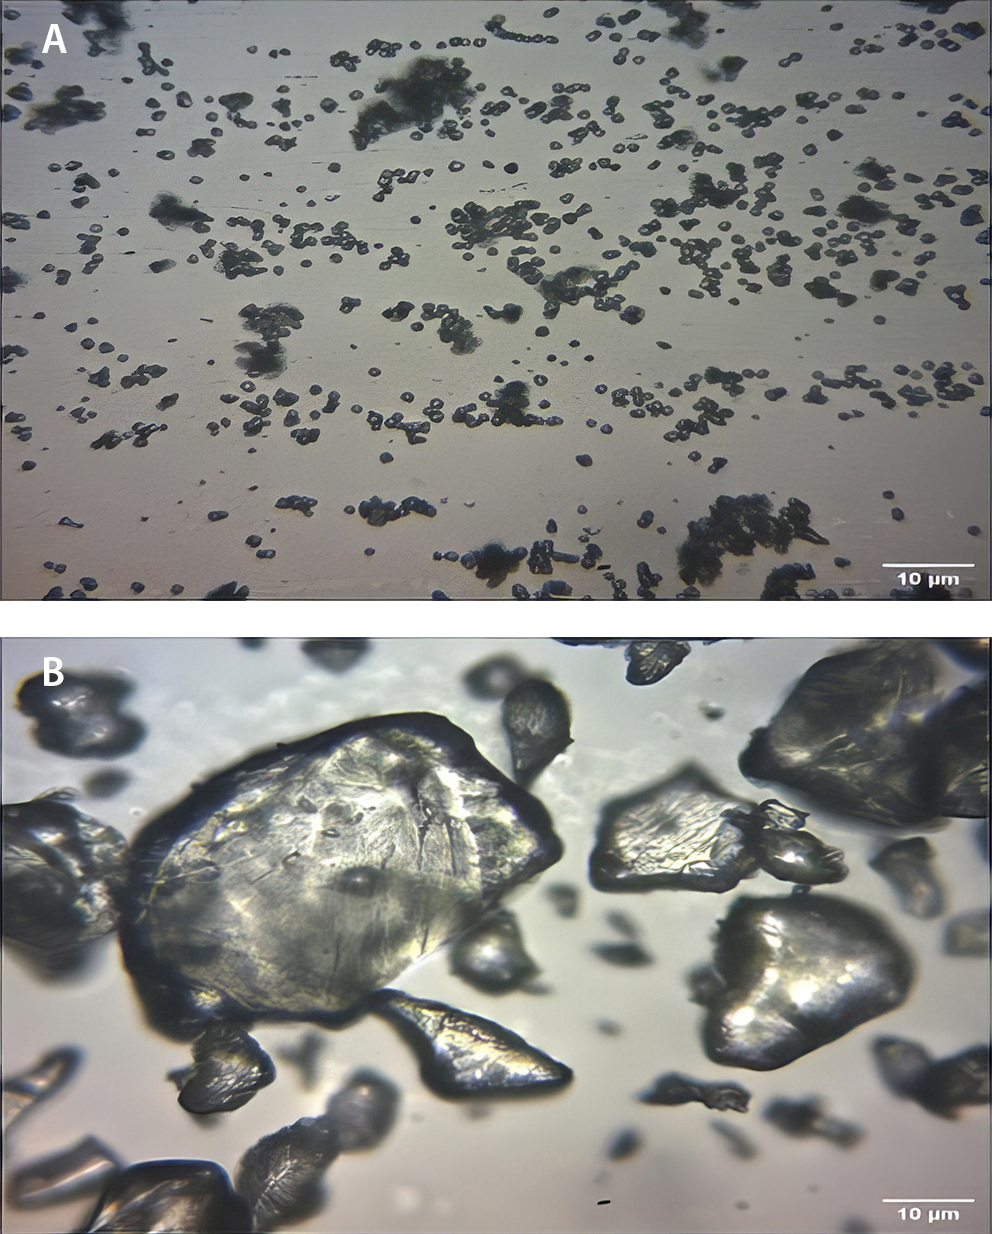
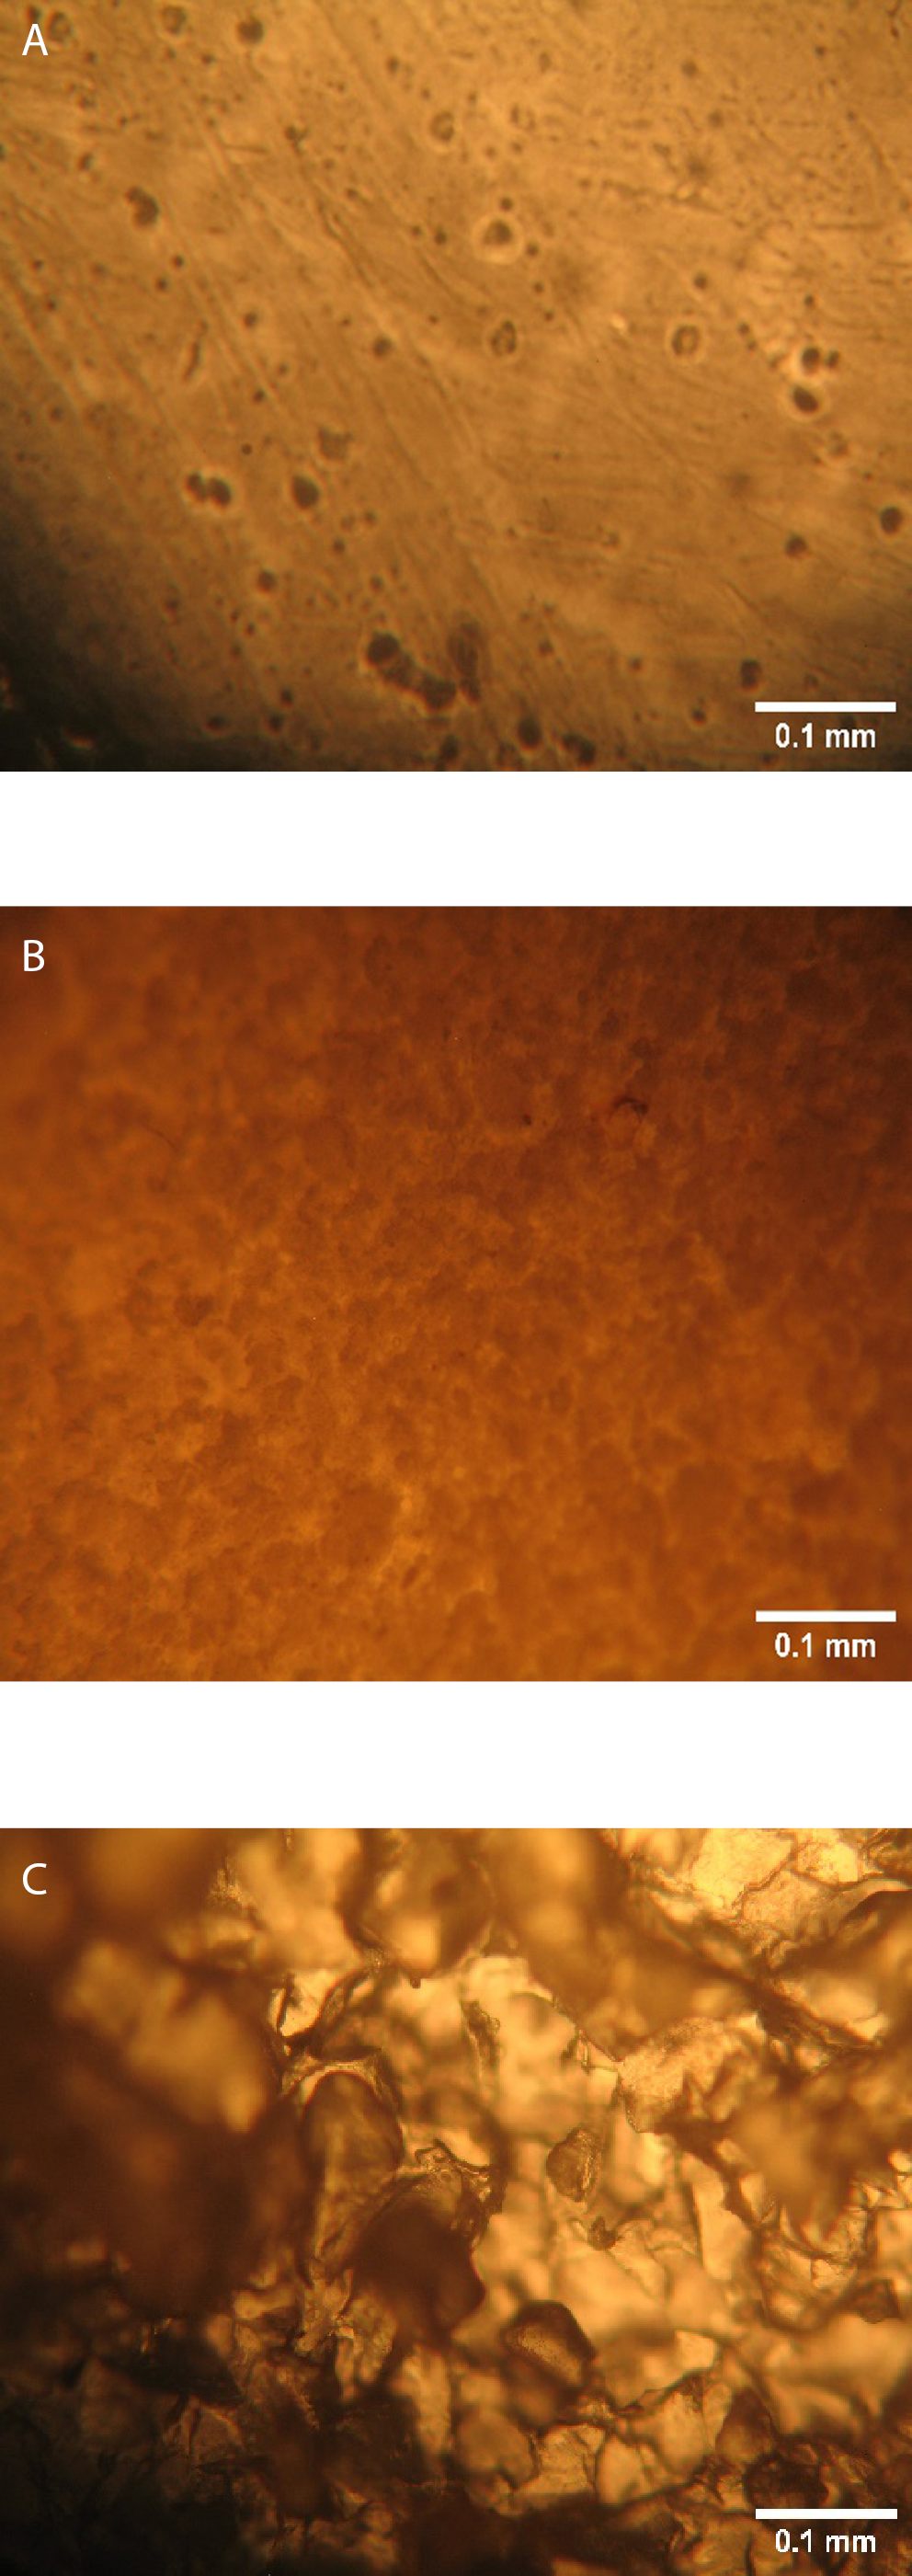
The result of particle size analysis as shown in Table 2 revealed a significant (p < 0.05) increase in mean particle size from 0.83 ±0.33 µm (NS) to 25.27 ±11.07 µm (PS). The photomicrograph (Figure 1) of the NS and PS at ×400 magnification showed a distinct morphological change after pregelatinization.
Native starch particles appeared smaller with smoother spherical shapes and relatively uniform distributions, while PS particles were larger, with fragmented irregular shapes and heterogenous size distribution.
pH and swellability
Both starches had acidic pH values, but the PS was more acidic. The swelling indices were significantly (p < 0.05) higher in PS across all media. Swelling index values ranged from 1.19 to 1.43 and from 2.92 to 3.93 for the NS and PS, respectively.
Solubility, moisture content and hydration capacity
Overall, PS demonstrated higher solubility (10.56% vs 8.50%), lower moisture content (12.10% vs 13.40%) and higher hydration capacity (3.6 vs 2.2) than NS.
Particle density, tapped density and bulk density
There was a general increase in all forms of density post-gelatinization. For particle density, PS had a value of 1.52 g/cm3 and NS had 1.47 g/cm3. The increase in the tapped and bulk densities was more significant (p < 0.05), as shown by PS having 0.64 and 0.72 g/cm3 bulk and tapped density respectively, and the NS having 0.40 and 0.60 g/cm3 bulk and tapped density, respectively.
Hausner ratio, Carr compressibility index, porosity, and angle of repose
Table 2 shows a significant (p < 0.05) reduction in Hausner ratio (1.14 vs 1.51) and Carr compressibility index (12.18% vs 33.63%) after pregelatinization. The angle of repose decreased from 57.18° in NS to 43.78° in PS, and the porosity of NS decreased from 72.76% to 58.15% in PS.
Pasting properties of the starches
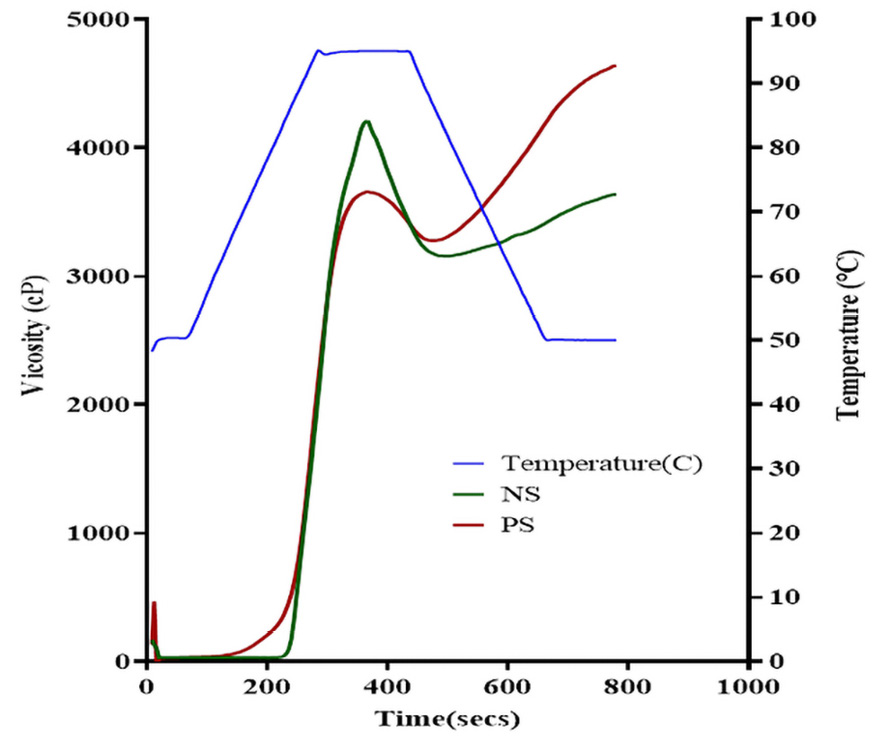
In Table 3 and Figure 2, NS exhibited a higher peak viscosity (4204 cP vs 3655 cP) and higher breakdown viscosity (1048 cP vs 379 cP) compared to PS. Although both forms exhibited the same peak time of 6.07 min, PS presented a lower pasting temperature (78.25°C vs 84.10°C) and higher final viscosity (4638 cP vs 3635 cP).
Fourier transform infrared spectroscopy
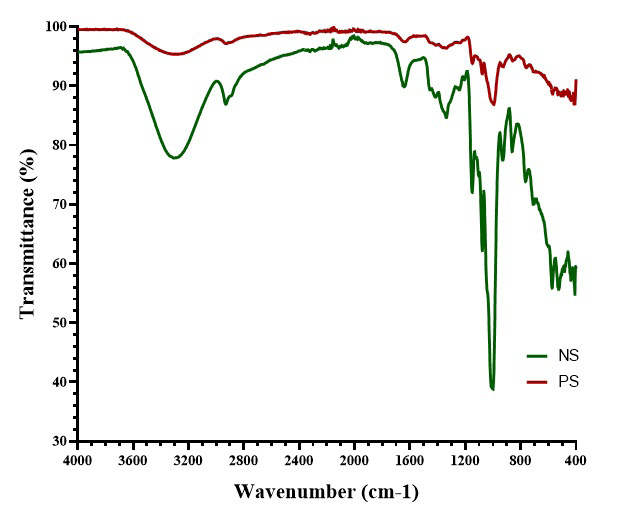
The FT-IR spectra (Figure 3) showed that the NS had pronounced absorption peaks around 3200 cm–1 (O-H stretching) and in the fingerprint region below 1200 cm–1 (C-O stretching and C-O-H bending). In contrast, the PS exhibited lower absorption peaks.
X-ray diffractometry
As seen in the X-ray diffractograms (Figure 4), the native and pregelatinized bitter yam starch showed no difference in their crystalline nature.
Differential scanning calorimetry
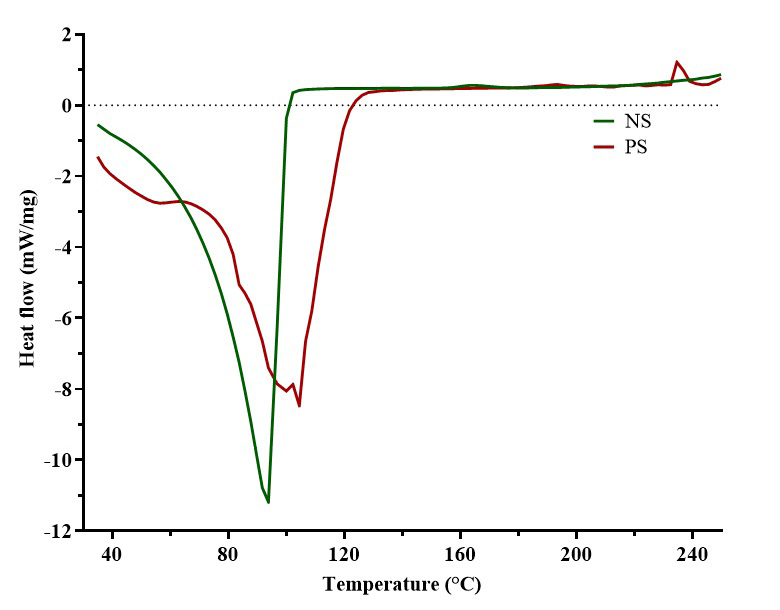
In the differential thermograms (Figure 5), NS showed a single, sharp endothermic peak around 100°C and a smooth, continuous curve from 40°C to 93°C, whereas PS showed a broader endothermic region around 80–120°C, multiple peaks in the endothermic region, and a small exothermic peak near 240°C.
Evaluation of oral dissolving films of the starches
Organoleptic properties and surface morphology of starch ODFs
The color shade differed depending on which starch type blended with HPMC, whether NS or PS, and color intensity decreased across the starch-to-HPMC ratios. The NS–HPMC 1:1 (NS-b) and PS–HPMC 1:2 (PS-c) samples were the most transparent among the characterized oral films of NS and PS.
Table 4 provides more information on the surface texture and transparency of the films. The NS films NS-a and NS-b showed dual coloring with brown and off-white colors at the tops and bottom surfaces of the films, respectively. While HP (the film formulation at HPMC–starch ratio 1:0) was the most transparent film, the NS films were the most translucent. Hydroxypropylmethyl cellulose, NS-a and NS-b films had smooth surface textures on both sides, while PS films (PS-a, PS-b and PS-c) exhibited smooth and rough surface textures on their top and bottom surfaces, respectively.
The photomicrograph in Figure 6 shows the surface morphologies of the films on a microscopic level. The HP showed a relatively smooth and uniform surface, and NS-a and NS-b revealed cracks with granular structures on their bottom surfaces. The PS-a, PS-b and PS-c films had irregular surface appearances with numerous surface irregularities and micro-cavities.
Weight and thickness uniformity
According to Table 5, HP exhibited the lowest weight (0.25 ±0.03 g), while NS-a showed the highest (0.36 ±0.03 g). All the PS films exhibited lower film weights than those of NS, with weight in the narrow range of 0.26–0.28 mg. Similarly, HP had the lowest thickness (0.44 ±0.04 mm), while the starch-based films exhibited higher thicknesses ranging from 0.53 to 0.60 mm, with PS-b showing the highest thickness (0.69 ±0.16 mm).
Film pH, folding endurance and disintegration time
Table 5 shows that the pH values of the films ranged from 4.89 to 6.11; HP had the highest pH (6.11) and the starch-ODFs had lower pH values, within a narrow range of 4.89–5.1. Among the starch-containing films, PS-c had the highest pH (5.10). The folding endurance values ranged from 1 to 10, with NS-a and HP showing the highest and lowest values, respectively. The PS ODFs (PS-a, PS-b and PS-c) had relatively higher values (5–8). All the ODFs had disintegration times greater than 15 min.
Discussion
Characterization of the native and pregelatinized starches
Particle size and morphology
Microscopic analysis was employed to identify differences in the characteristic morphology of the particles of both starches. The analysis of samples of the bitter yam starch forms showed distinct morphological changes following pregelatinization. A comparison of the photomicrographs obtained for native and modified starches revealed that pre-gelatinization disrupted the granular structure of the NS.7
Light microscopy revealed that the NS granules had smooth, intact surfaces with a well-defined ovoid/spherical shape. The granules were observed as loosely packed aggregates, indicative of minimal structural disruption. Pregelatinization led to visible fragmentation and rough, irregular particle shapes with significant structural changes. These alterations align with the typical effects of heat and moisture on starch granules, which disrupt crystallinity and create a more amorphous structure. Studies such as those by Okunlola et al. report similar findings, where pregelatinization causes granule swelling, fusion and eventual breakdown, resulting in particles that lose their organized, compact structures.7
The increase in particle size following the pregelatinization of bitter yam starch can be attributed to the swelling and fusion of granules. This change is consistent with findings that heating starch in the presence of moisture causes granules to absorb water and expand. The variation in particle size across samples is likely due to inconsistencies in how individual granules fracture, fuse or swell under thermal treatment, leading to a broader particle size distribution.1 The larger particle size observed is similar to the result obtained by Okunlola et al., and Omoteso and Odeniyi in the particle size analysis of PS of bitter yam, among other plant sources.7,4
pH and swellability
The pH results indicate that both the native and pregelatinized bitter yam starch samples fall below the ideal pH range for pharmaceutical applications, as stated by Rowe et al. For pharmaceutical starch excipients, a pH range between 4.0 and 8.0 is typically recommended, with PS ideally between 4.5 and 7.0, as these ranges ensure compatibility with most active pharmaceutical ingredients (APIs) and ensure formulation stability.26 Since most drugs are weak acids or bases, the use of these starches may induce stability problems for pH-sensitive drugs and potentially lead to irritation in certain drug delivery routes such as buccal and gastrointestinal. For excipient applications these bitter yam starches may require further processing steps or pH adjustments by neutralization or buffering to bring the pH closer to the desired range, enhancing its compatibility with APIs and reducing potential issues in formulations.
The PS exhibited a significantly (p < 0.05) higher swelling index compared to NS in all tested media, including water, 0.1 M hydrochloric acid, 6.8 phosphate buffer and 7.4 phosphate buffer. During pregelatinization, the granular structure of starch is disrupted, enhancing its hydrophilicity and allowing it to absorb more water. Gelatinization breaks intramolecular hydrogen bonds that link starch molecules, which not only loosens the starch structure to reduce restrictions to swelling, but also creates new opportunities for hydrogen bonding with water molecules. As a result, PS has a greater affinity for water, leading to an increased ability to swell.19 The higher swelling observed in the phosphate buffers (pH 6.8 and 7.4) suggests that PS may be beneficial for applications in buccal or gastrointestinal drug delivery, where rapid hydration is desired to facilitate the release and absorption of active ingredients.4
Solubility, moisture content and hydration capacity
Also, PS demonstrated higher solubility and hydration capacity than NS. These improved values stem from the structural modifications during the gelatinization process. Increased interaction with water facilitates both dissolution and dispersion in aqueous solutions, aiding the overall hydration process.4 The improved hydration capacity of PS is particularly advantageous for applications where rapid water absorption is needed, such as in oral dissolving films. The moisture content of both NS and PS fell within the official acceptable threshold of 14% for pharmaceutical materials.26 Pregelatinized starch exhibited a lower moisture content compared to NS, suggesting enhanced stability under storage conditions. Lower moisture content is desirable for extended shelf life, as it minimizes the risk of microbial growth and reduces the likelihood of spoilage, caking and the development of off-flavors or unwanted odors.5
Particle density, tapped density and bulk density
The results of this aspect of the study show that pregelatinization has a significant (p < 0.05) effect on the particle density, bulk density and tapped density of bitter yam starch. The marginally higher particle density of the modified starch is because the heat and water treatment disrupt the crystalline nature of the NS granule, resulting in the partial breakdown of intramolecular bonds of the starch and a rearrangement into a denser form.1
A more significant (p < 0.05) increase was observed with the bulk and tapped starch densities. Bulk density measures how well starch particles pack together without tapping or compression, while tapped density indicates how well they pack under tapping or vibration, which allows the particles to settle. The bulk density of a powder determines its packing behavior during the various tableting unit operations such as die filling, mixing, granulation, and compression.27 High bulk density is preferable mostly because it reduces the fill volume of the die; it contributes to better flow characteristics. The differences observed in the bulk density values could be due to the difference in particle shapes and sizes between the 2 starch forms which affected the packing arrangement of the powder particles.23
Porosity, Hausner ratio, Carr compressibility index, and angle of repose
Porosity is a crucial parameter that determines powder flow and pack behavior. The lower porosity of PS indicates that the particles can pack more densely with reduced inter-particle spaces; this confirms the observation of higher tapped density. This compact packing is beneficial for applications that require uniform density such as in tablet compression. The decrease in porosity is due to the changes in the chemical and physical nature of starch granules from the rearrangement of intra- and intermolecular bonds.28
These results show that pregelatinization improved the flow characteristics of the bitter yam starch, as evidenced by the decreased Hausner ratio, Carr index and angle of repose compared to the NS. Hausner ratio indicates the degree of densification that could occur during tableting; higher values predict significant densification of powders.27 A lower Hausner ratio typically indicates better flow properties, as values closer to one suggest reduced cohesiveness via minimal inter-particle friction.23 Carr compressibility index simultaneously measures the flowability and compressibility of a powder; the lower values indicate better flowability, but poorer compressibility due to reduced interparticle interactions.28 Carr index below 15% suggests good flow, while values above 25% indicate poor flow properties.29
The angle of repose is a qualitative measure of the cohesiveness or the tendency of powdered or granulated materials to flow from hoppers through the feed frame into tableting machines. An angle of repose above 50° is defined as poor flow, while values between 25° and 45° signify fair flow.29 The substantial reduction in the angle of repose in the PS is consistent with the flow improvements shown by Hausner ratio and Carr index.
Pasting properties of the starches
The pregelatinization process impacts the pasting properties of bitter yam starch, suggesting considerable changes in its functional behavior under heat and shear. Peak viscosity reflects the water-holding capacity and its ability to swell before granule disruption. The higher peak viscosity observed in NS compared to PS implies that NS granules retain their integrity better initially, resulting in greater initial viscosity.19 Conversely, PS, having undergone partial gelatinization, shows a lower peak viscosity, which is consistent with its increased solubility and faster hydration, previously observed.19,4
The lower pasting temperature of PS indicates that it gelatinizes at a lower temperature, likely due to structural changes from pregelatinization that make starch granules more receptive to water absorption and swelling at lower temperatures.30 This quality makes pregelatinized bitter yam starch suitable for processes requiring lower energy inputs or faster gelatinization, which is also beneficial in energy-saving applications, providing a cost-effective alternative for industrial processing.1
Fourier transform infrared spectroscopy
Characteristic peaks associated with starch molecules – including hydroxyl (O–H), C–H and carbonyl (C=O) groups – were detected in both starch forms, although with varying transmittance levels.19 For NS, the broad O–H stretching peak at 3305.13 cm–1 reflects hydroxyl groups engaged in hydrogen bonding. C–H stretching, linked to aliphatic C–H bonds, appears at 2928.1 cm–1, while C=O stretching bands, related to C=O and C–O–C glycosidic linkages integral to starch structure, are found at 1077.12 cm–1 and 1150.45 cm–1. A strong peak at 1647.8 cm–1, attributed to O–H bond scissoring from absorbed water molecules is also present. Additional peaks at 859.37 cm–1 and 524.76 cm–1, unique to the NS, occur due to stretching vibrations of the polymer skeletal structure.27 In PS, no remarkable changes in FT-IR peak positions were noted, though less pronounced peaks were observed. This signifies that pregelatinization may weaken some intra- and intermolecular bonds within the NS, resulting in broader peaks with reduced intensity.31
A strong peak at 1647.8 cm–1, attributed to O–H bond scissoring from absorbed water molecules is also present. Additional peaks at 859.37 cm–1 and 524.76 cm–1, unique to the NS, are due to stretching vibrations of the polymer skeletal structure.27 In PS, no remarkable changes in FT-IR peak positions were noted, though less pronounced peaks were observed. The pregelatinization process appears to weaken some intra- and intermolecular bonds within the NS, resulting in a more amorphous structure with reduced peak intensity.32
X-ray diffractometry
The XRD patterns provide a “fingerprint” of the crystalline structure to assess the structural impact of modification processes like pregelatinization.19 Both NS and PS exhibit well-defined, sharp peaks, which suggest that the starch granules retained their crystalline structure after the modification process. The prominent peaks at approx. 27° 2θ are characteristic of the A-type crystalline pattern commonly observed in cereal starches, reflecting an ordered molecular arrangement within the granules. Additionally, minor peaks at around 24° 2θ further support the presence of crystalline regions.32
Differential scanning calorimetry
In this study, DSC was utilized to investigate phase transitions and reveal distinct thermal behavior patterns between the NS and PS.33 The thermal profiles demonstrated that pregelatinization altered the thermal properties of bitter yam starch, with PS exhibiting more complex thermal behavior. The NS sample exhibited a single endothermic peak at 93.79°C, whereas the PA displayed multiple peaks, with the major endothermic transition occurring at 102.11°C. The endothermal peak indicates heat absorption by the samples and may be associated with processes such as melting and vaporization of water molecules within the starch polymer. Prior to the melting phase, the PS underwent glass transition at ~70°C. Higher melting temperatures and glass transition temperatures are commonly observed with increased amylose content, a characteristic property of PS.34 At elevated temperatures, reactions such as oxidation facilitates the breakage of chemical bonds within starch molecules. This reaction, coupled with the re-crystallization of decomposed starch polymers, results in the release of heat which is observed as the exothermic peak at 240°C of PS.35
Evaluation of oral dissolving films of the starches
Organoleptic properties and surface morphology
The pure HPMC film (HP) exhibited uniform, transparent and smooth textures, which are highly desirable in oral applications for consistent texture, clarity and a pleasant mouthfeel. The transparency suggests a well-formed, uniform structure with minimal internal scattering due to the absence of large particles and air bubbles.14 The inability of NS and PS alone to form films, despite the addition of glycerol as a plasticizer, points to their insufficient binding properties, which could lead to brittleness after drying. This outcome aligns with the findings of Ayorinde et al., who observed that starches alone exhibit poor film-forming properties, but show significant improvement when combined with HPMC in appropriate ratios.15
Native starch ODFs presented a 2-toned appearance, with brown and off-white layers, possibly due to oxidation or drying effects from environmental exposure. In contrast, PS ODFs displayed a uniform brown color, suggesting a more homogeneous film formation. The NS films were translucent, indicating partial light transmission, likely due to the opacity and limited solubility of NS. Pregelatinized starch films, on the other hand, had a semi-clear, less opaque appearance, possibly due to the increased solubility and cohesive properties of PS.30 Native starch films also showed pronounced crack patterns, indicating high crystallinity and brittleness.7
Surface texture analysis indicated that the HP films were smoothest on both sides. Native starch blends retained this smoothness, while the PS films displayed smoother tops and rougher bottoms. This roughness may impact the films’ dissolution and drug release rates, as smoother films likely dissolve more uniformly.17 Microscopic analysis revealed that HP films had a highly uniform surface, with no visible cracks or irregularities, demonstrating strong cohesive interactions in the polymer matrix. Starch-containing films, particularly those with higher starch content, displayed rougher textures. Pregelatinized starch ODFs were rougher on the top surface than NS films, likely due to larger particle sizes and high swelling properties of PS particles.36 Hydroxypropylmethyl cellulose enhances the smoothness of ODFs, while the starches contribute to textural variability, which may influence film dissolution and drug release. The choice and ratio of HPMC and starch are critical in optimizing the organoleptic and functional properties of ODFs.37,38
Weight and thickness uniformity
Weight variation is a crucial parameter in oral dissolving films for ensuring dose consistency, as it reflects the even distribution of active ingredients and excipients within the film.14,16 In this study, the weight variations of the film formulations ranged from 0.03 to 0.06 g, indicating good uniformity within each batch. This consistency also reflects the efficiency of the formulation method used. The HP film had the lowest average weight, suggesting that the presence of starches increased the bulk of the ODFs.17 Native starch films exhibited greater average weights, potentially due to the higher solubility and swelling capacity of PS.12
The low standard deviation in film thickness across formulations further confirmed the consistency and reliability of the method used.15 The inclusion of starch increased the thickness of the films substantially, likely due to the differing viscosities of the polymers used.17 The higher swelling ability of PS could explain why its ODFs generally exhibited slightly greater thicknesses compared to those with NS. An increase in thickness was observed with higher HPMC content in the starch films, which aligns with findings from Balogun-Agbaje et al. in their study of HPMC/potato starch ODF blends.14
Film pH, folding endurance, and disintegration time
The surface pH of ODFs is a key factor in ensuring patient compliance, as it helps predict potential in vivo adverse effects. To minimize the risk of oral mucosal irritation, the pH of these films should be near 7.0.16 The slightly acidic starch ODFs can be attributed to the intrinsic acidity of starch. This may affect the film stability and compatibility with pH-sensitive drugs and excipients. The mechanical strength of the films was evaluated by assessing folding endurance, which measures film flexibility or brittleness.16 Generally, a folding endurance value of approx. 300 folds is recommended for ideal flexibility.39 However, all films in this study exhibited folding endurance values well below this threshold. The HP films displayed higher folding endurance than starch-based formulations, indicating greater flexibility. Films formulated with NS (NS-a and NS-b) exhibited low folding endurance, reflecting the brittleness and rigid crystalline structure characteristic of NS. In contrast, PS films demonstrated better folding ability due to the amorphous nature of PS.11 Both NS and PS ODFs showed increased flexibility with increasing HPMC concentrations. Disintegration time is important for formulations that require rapid drug release applications. The ideal disintegration time is between 5 s and 30 s. 13 All ODFs displayed disintegration times exceeding 15 min. Adjustments to the starch-to-HPMC ratio or the addition of super disintegrants could be a way to reduce disintegration times.
Conclusions
Pregelatinization of bitter yam starch improves physicochemical properties such as swelling, solubility and hydration capacity. This modification method also remarkably improves the flow and pasting properties of bitter yam starch as well as its surface morphology and thermal characteristics. Both starch forms of bitter yam produced thicker and heavier ODFs, which could potentially impact patient acceptability and ease of use. Pregelatinized starch ODFs have better mechanical strength and flexibility compared to NS ODFs. The acidic pH values of the starch ODFs pose a risk of mucosal irritation and reduced stability of pH-sensitive drugs and excipients. The use of bitter yam starches as film formers for ODFs would require additional formulation modifications to meet the mechanical strength, rapid dissolution and pH criteria for ODFs.
Data availability
The datasets generated and/or analyzed during the current study are available from the corresponding author on reasonable request.
Consent for publication
Not applicable.
Use of AI and AI-assisted technologies
Not applicable.