Abstract
Background. Hepatitis C virus (HCV) causes long-term liver disease. Its capacity to influence the host immune system makes its pathogenesis more complicated. Targeting the IFITM3 gene presents a promising therapeutic strategy for treating HCV infections, as it blocks the virus from entering host cells.
Objectives. This study examines how HCV viral loads affect IFITM3 gene expression.
Materials and methods. This study included 100 patient samples diagnosed with HCV through serological methods and confirmed as positive. Then, viral and human RNA were extracted using commercial kits. The viral RNA was then quantified using one-step real-time polymerase chain reaction (qPCR), enabling an accurate assessment of viral load in the blood. Following this, human RNA was converted to cDNA and quantified using qPCR to investigate IFITM3 gene expression.
Results. The distribution of blood groups among HCV-positive and HCV-negative samples showed that samples with the O– blood group had a significantly higher frequency of HCV positivity (18.4%) compared to the HCV-negative group (2.0%). Age analysis indicated a significant difference between HCV-positive and HCV-negative individuals with mean age of 37.8 ±1.48 years and 44.1 ±1.56 years, respectively. The expression levels of the IFITM3 gene were significantly higher in the HCV-positive group (4.21 ±1.17 fold) compared to the HCV-negative group (1.36 ±0.157 fold), with a p-value of 0.016. A correlation analysis between IFITM3 gene expression levels and HCV viral loads showed r-value of 0.343, indicating a moderate positive correlation, with p-value of 0.016.
Conclusions. Strong correlations observed in this study show the need for a comprehensive understanding and management approach to HCV disease. These relationships should be studied longitudinally to verify causality and assess potential interventions. IFITM3 gene expression as a biomarker for HCV infection and disease progression warrants further investigation.
Key words: hepatitis, qPCR cirrhosis, fold, virus
Background
Hepatitis C is a significant liver diseases caused by the hepatitis C virus (HCV) that has an impact on health and mortality worldwide.1 Unlike other types of hepatitis, HCV tends to result in chronic infection for a number of those affected. The primary mode of HCV transmission is blood exposure, which can occur through, e.g., injection drug use, improper sterilization of medical equipment or blood transfusions.2
Other important risk factors include high-risk behaviors and mother-to-child transmission during pregnancy.3 Understanding these modes of transmission plays a role in developing effective prevention strategies and early intervention measures.4 The symptoms and outcomes of HCV infection vary widely among individuals. While some people are able to eliminate the virus from the organism, many develop chronic infections that can progress to serious conditions such as liver cirrhosis, liver failure or hepatocellular carcinoma (HCC, a type of liver cancer).5
The interactions between HCV and the host immune system contribute to the wide range of disease progression.6 The IFITM3 gene is one of the crucial elements in the immune system’s defense against infections.7 The IFITM3 gene is located on chromosome 11 and it is activated interferon signaling.8 Recent research has shown growing interest in its potential to reduce viral replication rates. This effect is believed to occur by blocking the viral entry into host cells, a mechanism that is activated by interferon during infections.9
However, researchers have proposed a hypothesis indicating that HCV influences the expression of IFITM3 gene, which in turn may impact the development and outcome of the infection.10 Further investigation is required to comprehend the role of IFITM3 in HCV infections.
The initial step in detecting HCV involves examining the patient’s serum for the presence of HCV antibodies.11 While this serological test is convenient, it is important to note that even if a patient has recovered from HCV, the antibodies may still yield a positive result. This emphasizes the necessity of additional confirmatory tests to accurately diagnose an active infection.12
Objectives
Monitoring HCV viral loads is essential for assessing treatment response and predicting disease prognosis.13 Additionally, the high sensitivity and specificity of real-time quantitative polymerase chain reaction (qPCR) make it an effective method for detecting HCV infections.14 It is important to have an understanding of how HCV impacts the expression of the IFITM3 gene in terms of its clinical implications. This research has the potential to reveal novel targets and strategies for managing HCV infections. Exploring the relationship between HCV and IFITM3 can provide valuable insights into virology and immunology, ultimately enhancing our understanding of HCV pathogenesis and host defense mechanisms.
Materials and methods
Ethical approval
The current study was conducted after obtaining the ethical approval from the Human Ethical Committee of Al-Nahrain University, Baghdad, Iraq (Ref. 689, dated March 10, 2024).
Samples collection
This research was conducted at Al-Kadhmya Teaching Hospital (Baghdad, Iraq) between August 2022 and October 2023. A total of 100 samples were collected, specifically chosen based on the tests results. All participants had previously tested positive for HCV antibodies, detected using the HCV Ab Rapid Test. The serological tests used in this study were sourced from LINEAR (Barcelona, Spain). This selection process ensured that our research focused on individuals who had been serologically confirmed to have been exposed to HCV, making the findings relevant and targeted. The Anti-HCV cassette (LINEAR) was used for detection. The reagent composition included HCV test devices, which contain protein A-coated particles and HCV antigen-coated membranes.
HCV RNA extraction
The Ribo Virus (K 2/C) kit (Sacace Biotechnologies, Como,
Italy) was used to extract RNA from cell fluids, following the instructions provided by the manufacturer. In a tube, 600 µL of buffer RAV1 (Sacace Biotechnologies; containing carrier RNA) was combined with 150 µL of serum. The mixture, along with negative controls specified using the PCR kit, was briefly mixed by pulse vortexing for 15 s, then incubated at 70°C for 5 min. If there was any turbidity after incubation, the samples were centrifuged at 11,000 × g for 1 min. The liquid supernatant was carefully transferred to a new tube to prevent clogging during column purification. Next, 600 µL of ethanol (96%) was added to the lysed sample. After vortexing and brief centrifugation, the mixture was applied to Ribo Virus columns placed within 2 µL centrifuge tubes. Several wash steps were performed using buffers RAW and RAV3. Finally, RNA was eluted from the columns using RNase-free water preheated to 70°C. The resulting viral RNA was stored at –20°C until it was used for qPCR on the designated working day.
HCV real-time quantitative PCR
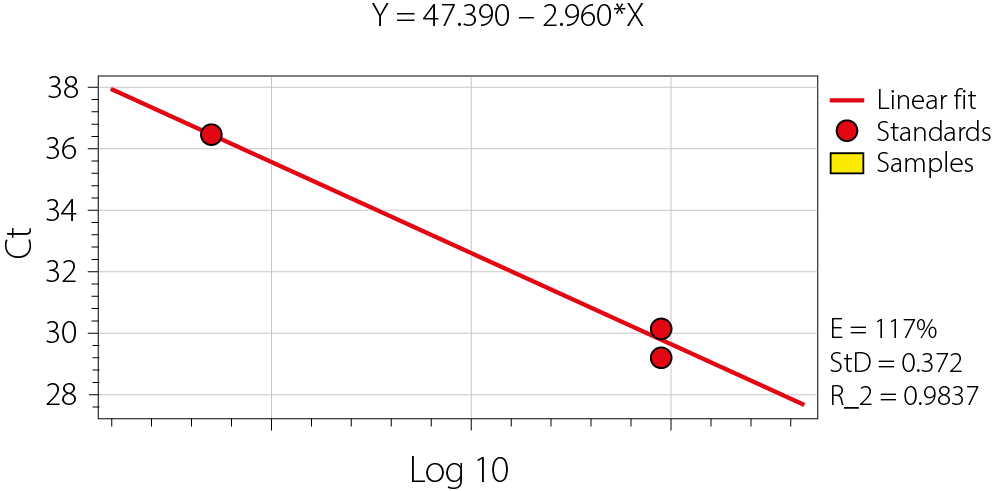
HCV RNA was quantitatively detected using the HCV Real-TM Quant kit (Sacace Biotechnologies). A standard curve was generated for the quantitative determination of HCV RNA levels using qPCR (Figure 1). This approach utilized dual-color detection to simultaneously identify HCV-specific RNA and the internal control (IC). Hot Start Taq Polymerase, M-MLV Revertase, RT-PCR-mix-1, and
RT-PCR-mix-2 (Sacace Biotechnologies) were then added to the tube to create the reaction mix.
Next, 12.5 µL of the reaction mix was aliquoted into each reaction tube. After preparing the reaction tubes or PCR plate, 12.5 µL of the extracted RNA sample was transferred into the appropriate tube containing the reaction mix. Before being added, the RNA samples were meticulously re-centrifuged, ensuring that the pellet remained undisturbed, while only the supernatant was used. For qPCR, a set of standards and a negative control (NC) were prepared using the provided Quantitation Standards for HCV and IC, while TE-buffer was used for the PCR NC.
The reaction tubes were sealed and then placed into the qPCR for amplification. The process began with an initial reverse transcription step at 50.0°C for 15 min, followed by a denaturation step at 95.0°C for 15 min. The PCR amplification protocol was carried out under the specified thermal cycling conditions, which included 5 cycles of denaturation at 95.0°C for 5 s, annealing at 60.0°C for 20 s and extension at 72.0°C for 15 s. After that, there were 40 cycles of denaturation (for 5 s at 95.0°C), annealing (for 30 s at 60.0°C) and extension (for 15 s at 72.0°C). Then, the data were examined to determine the existence and amount of HCV RNA, while the IC was used to confirm the RNA extraction process and detect any potential PCR inhibition. The precision and reliability of HCV viral load measurement, which is essential for patient prognosis and tracking response to antiviral medication, were guaranteed by the implementation of ICs and strict adherence to PCR setup methods. According to clinical guidelines, a sustained virological response was defined as the lack of detectable HCV RNA 6 months after treatment termination.
Human RNA extraction
RNA was extracted from the samples using the RNeasy Micro Kit from Qiagen (Hilden, Germany). The eluted RNA was then converted into cDNA using the PrimeScript kit (Takara, Tokyo, Japan), which involved adding 2.0 µL of cDNA synthesis mix, 5.0 µL of RNA sample and nuclease free H2O up to 10 μL for each sample. The tubes were then placed in a cycler machine, set to maintain a temperature of 37°C for 30 min. Once the 30-min incubation was complete, the cDNA was ready for use. For relative quantification of the IFITM3 gene using qPCR, the following primer sequences were used:
Forward: 5’-TTCTGCTGCCTGGGCTTCATAG-3’
Reverse: 5’-ACCAAGGTGCTGATGTTCAGGC-3’
For normalization of results, the GAPDH gene was used as a reference gene, with the following primer sequences:
Forward: 5’-GATGGCAACAATCTCCACTTTGC-3’
Reverse: 5’-GCCGCATCTTCTTGTGCAGT-3’.
The qPCR reaction mixture for each sample was prepared as follows: 10 μL of KAPA SYBR green FAST qPCR Universal, 0.5 of forward primer and reverse primer and 5 of previously prepared cDNA, with nuclease-free water added to a final volume of 20 µL. The prepared tubes were then placed into the thermocycler, and the amplification and detection were programmed with the following cycling conditions: enzyme activation (95°C for 10 min), then 40 cycles of denaturation 95.0° for 30 s, annealing 60.0°C for 30 s and extension 72.0°C for 30 s.
Statistical analyses
Several statistical techniques, including the χ2 test and average with standard error (SE), and Student’s t-test was used to compare 2 independent scale parameters. Regression analysis, 95% confidence intervals (95% CIs) and hypothesis testing frequently involve the mean, median and SE – 3 essential basics of inferential statistics. The HCV viral load experiment’s resultant curves are represented by the standard curve for the quantitative assessment of HCV RNA levels obtained with qPCR.
Results
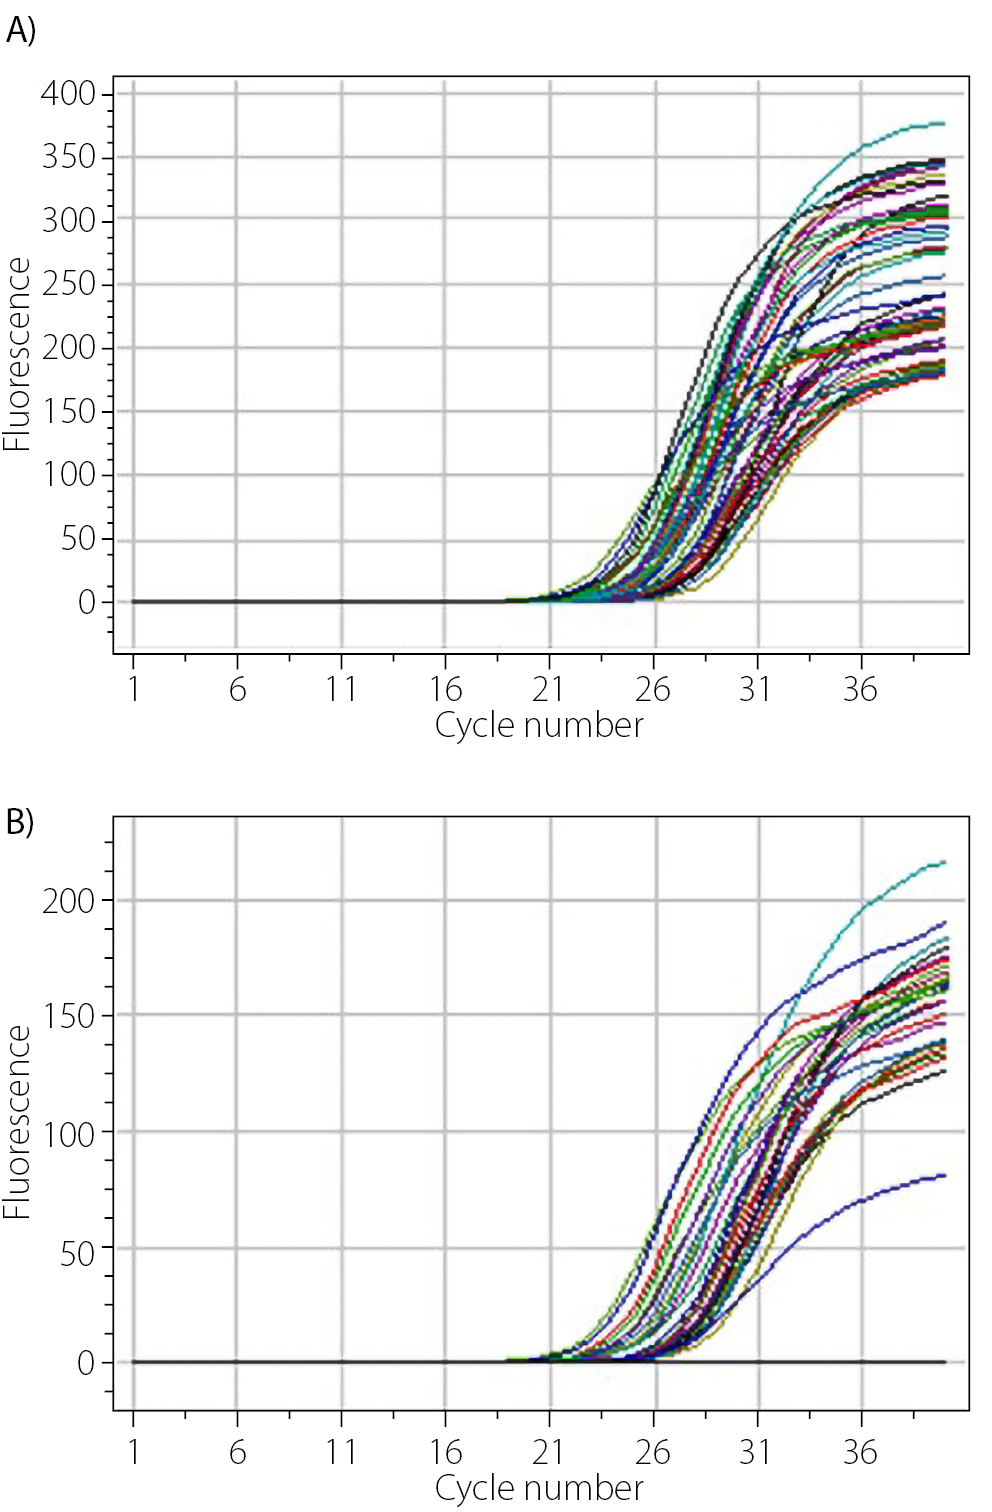
After completing the qPCR run of each experiment, amplification curves were generated, representing the amplification of the target sequence. Figure 2 displays the amplification curves obtained from the gene expression analysis after the qPCR run. Figure 2 illustrates the resultant curves from the HCV viral load experiment.
The investigation into the relationship between blood group, gender, age, and HCV infection status revealed several notable findings, as shown in Table 1. A total of 100 individuals were included in the study, with 49 testing positive for HCV and 51 testing negative for HCV. When examining the distribution of blood groups among the HCV-positive and HCV-negative cohorts, the χ2 test yielded a value of 17.2, indicating a statistically significant association between blood group and HCV status (p = 0.016). Notably, the proportion of individuals with the 0− blood group was markedly higher in the HCV-positive group (18.4%) compared to the HCV-negative group (2.0%). Conversely, a lower percentage of individuals with the A− blood group were HCV-positive (14.3%) compared to HCV-negative individuals (3.9%). This suggests that certain blood groups may be more prevalent among HCV-positive population within this sample. Gender distribution between the HCV-positive and HCV-negative groups did not show a statistically significant difference (χ2 = 0.642, p-value = 0.421), with women representing 55.1% of the HCV-positive group and 47.1% of the HCV-negative group. The average age of HCV-positive individuals was 37.8 years (±1.48), while the HCV-negative group had an average age of 44.1 years (±1.56), indicating a significant difference between the 2 groups.
The significance level for this difference was p = 0.005, which is statistically significant, suggesting that HCV positivity is associated with a younger age in this population. The expression levels of the IFITM3 gene were compared between individuals who tested positive for HCV (n = 49) and those who tested negative (n = 51), with the results summarized in Table 2. The mean fold expression of the IFITM3 gene in the HCV-positive group was significantly higher (mean = 4.21, median = 2.09, SE = 1.17) compared to the HCV-negative group (mean = 1.36, median = 0.975, SE = 0.157). The difference between the 2 groups was statistically significant, as indicated by a p-value of 0.016.
The noticeable increase in the IFITM3 expression among individuals infected with HCV indicates that this gene might have a role to play in respond to HCV infection. The higher SE observed in the HCV-positive group suggests that there is variability in IFITM3 gene expression among these individuals, which could be influenced by factors such as the stage of infection, viral load or individual immune response.
The research investigated the prevalence of HCV-positive and HCV-negative samples according to the presence of other chronic diseases, as shown in Table 3. Statistical analysis using the χ2 test revealed a significant difference between the 2 groups (χ² = 50, p = 0.001), indicating an unequal distribution of chronic diseases among individuals with and without HCV. Notably, a higher percentage (26.5%) of HCV-positive individuals were found to have alcoholic steatohepatitis (NASH) compared to only 3.9% in the HCV-negative group.
These findings suggest a potential link between HCV infection and the presence of NASH. On the other hand, both groups showed similar proportions in terms of hepatocellular carcinoma (HCC, i.e., liver cancer), with rates of 10.2% in HCV-positive individuals and 9.8% in HCV-negative individuals. This indicates that HCV presence did not significantly impact the occurrence of liver cancer in this sample. Other notable findings include the following: Cardiovascular disease (CVD)) was more prevalent in the HCV-positive group (14.3%) compared to the HCV-negative group (7.8%). Chronic kidney disease (CKD) was more common in HCV-positive individuals (22.4%) compared to HCV-negative individuals (7.8%). Type 2 diabetes mellitus was observed in 10.2% of HCV-positive individuals, compared to only 2.0% of HCV-negative individuals, suggesting a possible link between HCV infection and the development of type 2 diabetes. A significant portion of the HCV-negative group (49.0%) reported having no other chronic diseases, whereas only 2.0% of HCV-positive individuals reported no additional chronic conditions.
This analysis examines the mean HCV viral load across different blood groups, revealing variability in viral loads among them. Notably, individuals with the A− blood group exhibited a significantly higher mean viral load (2.11E + 06), accompanied by a large SE (1.67E + 06). This suggests substantial variability within this group. The large SE relative to the mean indicates that the data may be highly variable or influenced by outliers, which could impact the overall interpretation of viral load distribution across different blood groups.
The B+ blood group also exhibited a relatively high mean viral load (315.336) with a substantial SE (314.788), indicating high variability among individuals in this group. On the other hand, the A+ and AB− blood groups had the lowest mean viral loads (50.999 and 26.827, respectively) with comparatively smaller SE, suggesting a more consistent viral load among individuals in these groups (as shown in Table 4). The p-value of 0.347 indicates no statistically significant connection between blood group and HCV viral load at the alpha level of 0.05. This suggests that any observed differences in viral load across blood groups are likely due to chance rather than a real effect. However, the higher variability observed in A− and B+ blood groups may be worth further investigation. Exploring potential contributing factors such as stage of infection, history of antiviral treatment, and genetic influences on viral replication could provide deeper insights into why certain blood groups exhibit greater variability in HCV viral load.
The data analysis presented in Table 5 provides insights into HCV viral load levels in patients with coexisting chronic conditions. The study reveals variations in viral loads across different conditions, suggesting a potential link between HCV severity and the presence of chronic diseases. Among all patients, those diagnosed with type 2 diabetes mellitus exhibited the highest average HCV viral load (2.52E + 06), accompanied by a large SE (2.38E + 06). This indicates substantial variability in viral loads among individuals with diabetes, suggesting that type 2 diabetes may influence HCV replication or disease progression. However, due to the large SE, these findings should be interpreted cautiously. The variability observed suggests that additional factors, such as disease stage, immune response or treatment history, may contribute to differences in HCV viral load among individuals with type 2 diabetes. Further investigation is needed to determine the precise nature of this relationship.
On the other hand, patients without any chronic diseases had the lowest mean viral load (455), which was significantly lower than that of individuals with comorbidities. This finding suggests that the absence of chronic diseases may be associated with a lower HCV burden. This difference could be attributed to a compromised immune system in individuals with chronic diseases, making them more susceptible to higher viral replication, and the absence of potential interactions between HCV and other diseases, which might otherwise work synergistically to worsen infection severity. For other chronic conditions, such as fatty liver disease (NASH), HCC, CVD, and essential hypertension, the mean viral loads ranged from 79.287 to 282.420. Notably, patients with NASH had a mean viral load of 269.269 with a SE of 99.975, suggesting a possible link between NASH and higher HCV viral loads. Standard errors across most conditions, except for type 2 diabetes and CVD were relatively lower compared to their means, indicating a reasonable level of confidence in the mean estimates for these conditions.
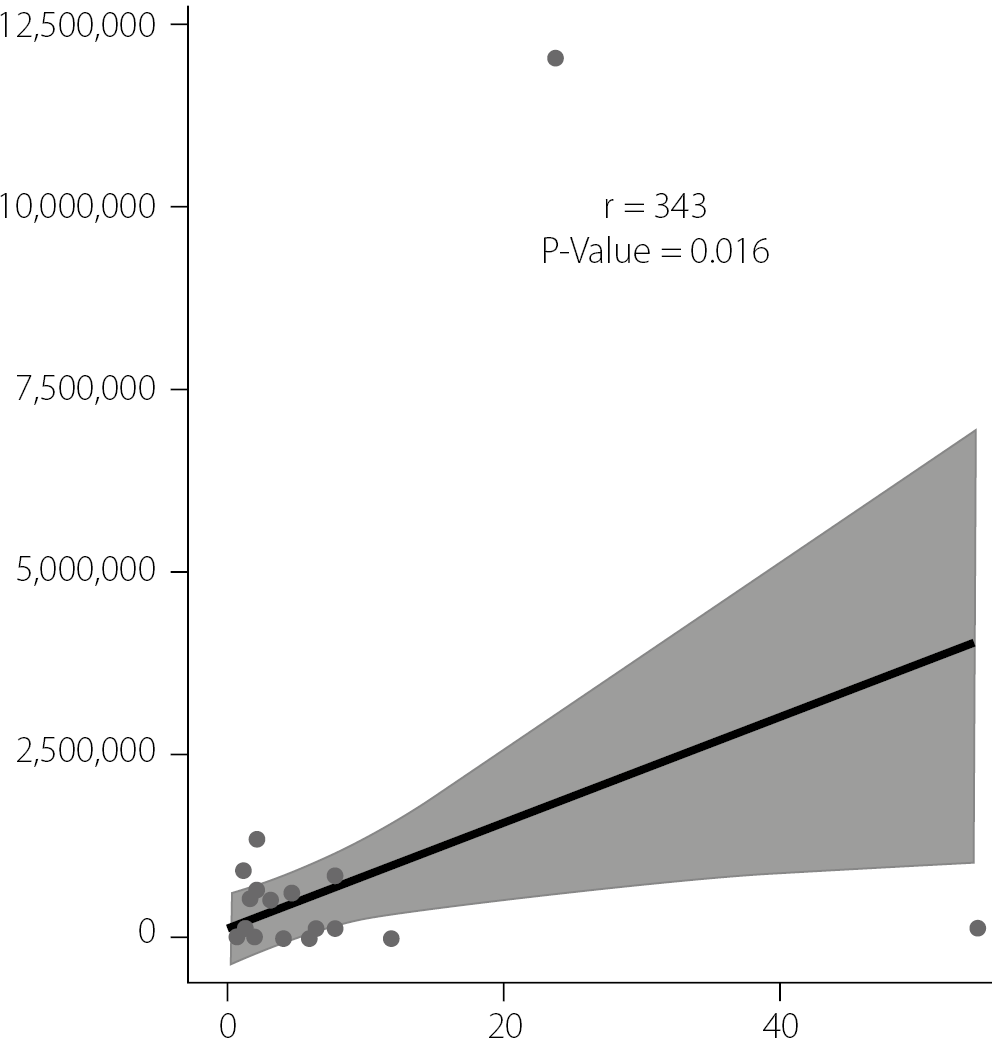
The scatter plot in Figure 3 was used to assess the correlation between IFITM3 gene expression levels and HCV viral loads. A correlation coefficient (r) of 0.343 indicates a moderate positive correlation, suggesting that higher IFITM3 gene expression tends to coincide with increased HCV viral loads. The p-value of 0.016, which is below the conventional threshold of 0.05, indicates that this correlation is statistically significant and unlikely to be due to chance.
The positive correlation suggests a potential association between IFITM3 gene expression levels and increased HCV loads. This could indicate that the IFITM3 gene plays a role in the replication or life cycle of the HCV, or it might reflect an enhanced host response to higher viral loads. The shaded region surrounding the regression line, presumably representing the 95% CI, indicates variability in estimating IFITM3 gene expression for any given HCV load. This variability is expected and suggests that, while an overall trend exists, individual data points may deviate due to factors not considered in our analysis.
The regression analysis was conducted to evaluate the relationship between HCV viral load and IFITM3 gene expression while controlling for potential confounders such as age, gender, blood group, and the presence of chronic conditions. The HCV viral load emerged as a significant predictor of IFITM3 expression, with an estimated coefficient of 0.356 and a p-value of 0.016. This finding suggests that for each unit increase in viral load, IFITM3 expression increases by 0.356 units, indicating a positive association between viral load and IFITM3 gene expression.
This significant relationship underscores the potential role of viral load in modulating IFITM3 expression levels in patients with HCV. In contrast, age did not show a significant association with IFITM3 expression (estimate = 0.00503, p = 0.97), suggesting that age has a negligible effect in this population. Similarly, gender (male) was not a significant predictor (estimate = −3.141, p = 0.297), although the negative coefficient hints at a trend toward lower IFITM3 expression in men, which was not statistically significant.
The analysis also examined the effect of blood group on IFITM3 expression. While most blood groups (A+, AB−, AB+, B−, B+, 0+) did not significantly affect IFITM3 expression, blood group 0− exhibited a marginally significant positive association (p = 0.073). Individuals with blood group 0− might have higher IFITM3 expression compared to those with other blood groups; however, the statistical evidence is not strong enough to draw firm conclusions. Regarding chronic conditions, type 2 diabetes mellitus emerged as a significant predictor of IFITM3 expression, with an estimate of 5.074 and a p-value of 0.038. This indicates that individuals with type 2 diabetes tend to have higher levels of IFITM3 expression, suggesting a potential link between metabolic disorders and the regulation of IFITM3. In contrast, other chronic conditions such as CKD essential hypertension, and NASH did not show significant associations with IFITM3 expression (Table 6).
Discussion
Diagnosing and treating HCV infection is challenging because HCV can lead to cirrhosis and HCC,15 and its mutation rate and genetic variability further complicate treatment.16 It is estimated that 71 million people globally are infected with HCV, stressing the need for effective treatments and a better knowledge of its pathogenesis.17 Interferon-induced transmembrane protein 3 helps fight viral infections18 by preventing viral entry into host cells, thereby conferring resistance.19
The antiviral activity of IFITM3 primarily stems from its ability to restrict fusion between viruses and host cell membranes – a critical step in the viral life cycle.20 IFITM3 is localized within lysosomal membranes and is believed to modify their properties, effectively blocking the release of viral genetic material into the cytosol. This function becomes particularly significant in the context of HCV, which relies on this pathway to enter hepatocytes.21
Recent studies have shed light on the function of IFITM3 in HCV infection.22 Evidence suggests that upon infection, the body may upregulate IFITM3, which could influence viral levels and disease progression. IFITM3 is now being considered both as a potential therapeutic target and as a marker to assess HCV infection severity and treatment response.23 Our understanding of IFITM3’s role in HCV infection is still evolving, and ongoing research aims to uncover its range of antiviral properties and mechanisms. By studying how HCV interacts with factors like IFITM3 within the body, we can develop new strategies to combat HCV and improve patient outcomes. In this study, we explored the relationship between HCV infection and various demographic and clinical factors, including blood group, gender, age, IFITM3 gene expression, and coexisting chronic diseases.
Analysis of blood group distribution among HCV-positive and HCV-negative individuals revealed a significant association (p = 0.016), with blood group 0− being more prevalent in the HCV-positive cohort. It is hypothesized that individuals with the 0− blood group might exhibit an altered immune response, potentially affecting the expression of antiviral genes such as IFITM3. Given that IFITM3 plays a crucial role in blocking viral entry into host cells, it is plausible that blood group antigens modulate interferon responses, which in turn influence IFITM3 gene expression and viral load. However, this area warrants further investigation.
Contrary to gender, where no significant association was found (p = 0.421), age showed a significant difference, with the HCV-positive group being younger on average (p = 0.005). This information suggests that younger individuals with certain blood types may require closer monitoring of viral infections. These results align with a previous study that also found the highest prevalence of HCV infections among individuals with blood group 0−.24 In addition, the study observed a significant upregulation of IFITM3 gene expression in HCV-positive individuals (p = 0.016), suggesting that IFITM3 plays a role in the immune response to HCV infection. These findings are supported by previous research.25
This is further supported by the positive correlation between IFITM3 expression and HCV viral loads (r = 0.343, p = 0.016), which indicates a potential interaction between host genetic factors and viral replication dynamics. Additionally, when examining the relationship between HCV infection severity and the presence of other chronic diseases, our analysis revealed a significantly higher prevalence of conditions such as NASH, CKD and type 2 diabetes mellitus among HCV-infected individuals.
This prevalence underscores the need for comprehensive management strategies that address not only HCV but also these co-morbid conditions, which can influence disease progression and treatment responses. Nonetheless, the mean HCV viral load did not correlate with blood group (p = 0.347), suggesting that blood type may not directly affect viral replication in HCV pathogenesis. Given the heterogeneity in viral loads across blood types and chronic conditions, particularly the high mean viral load observed in patients with type 2 diabetes mellitus, further research is needed to determine how these variables may impact disease severity or treatment efficacy. Additionally, the PCR method is recommended for virus identification and is widely used across microbiology and medical fields as a molecular diagnostic approach.26, 27, 28, 29, 30, 31, 32, 33, 34, 35, 36
Conclusions
The impressive correlations observed in this research underscore the need for a comprehensive strategy to understand and manage HCV disease. Future investigations, particularly those employing longitudinal data, are necessary to elucidate the mechanisms behind these associations, establish causality, and assess the impact of interventions. Additionally, further study of IFITM3 gene expression as a potential biomarker for HCV infection and progression holds considerable promise.
Data availability
The datasets generated and/or analyzed during the current study are available from the corresponding author on reasonable request.
Consent for publication
Not applicable.
Use of AI and AI-assisted technologies
Not applicable.