Abstract
Developing the analytical procedure requires estimating what independent variables will be tested and at what levels. There are statistical models that enable the optimization of the process. They involve statistical analysis, which indicates the crucial factors for the process and the potential interactions between the analyzed variables. Analysis of variance (ANOVA) is applied in the evaluation of the significance of the independent variables and their interactions. The most commonly used chemometric models are Box–Behnken Design, Central Composite Design and Doehlert Design, which are second-order fractional models. The alternative may be the artificial neural networks (ANN), whose structure is based on the connection of neurons in the human brain. They consist of the input, hidden and output layer. In such analysis, the activation functions must be defined. Both approaches might be useful in planning the analytical procedure, as well as in predicting the response prior to performance the measurements. The proposed procedures may be applied for polymeric systems.
Keywords: optimization, artificial intelligence, Box–Behnken Design, Central Composite Design, Doehlert Design
Streszczenie
Opracowanie procedury analitycznej wymaga określenia, jakie zmienne niezależne będą testowane i na jakich poziomach. Istnieją modele statystyczne, które umożliwiają optymalizację procesu. Polegają one na analizie statystycznej, która wskazuje czynniki istotne dla procesu oraz potencjalne interakcje pomiędzy analizowanymi zmiennymi. Analiza wariancji (analysis of variance – ANOVA) stosowana jest do oceny istotności zmiennych niezależnych i ich interakcji. Najczęściej stosowanymi modelami chemometrycznymi są modele Box–Behnken Design, Central Composite Design i Doehlert Design. Są to modele frakcyjne drugiego rzędu. Alternatywą mogą być sztuczne sieci neuronowe (artificial neural networks – ANN), których budowa opiera się na połączeniu neuronów w mózgu człowieka. Składają się one z warstwy wejściowej, ukrytej i wyjściowej. W przypadku tej analizy należy zdefiniować funkcje aktywacji. Obydwa podejścia mogą być przydatne w planowaniu procedury analitycznej, a także w przewidywaniu wyniku przed wykonaniem pomiarów. Zaproponowane procedury mogą być zastosowane w systemach polimerowych.
Słowa kluczowe: optymalizacja, sztuczna inteligencja, Central Composite Design, Box–Behnken Design, Doehlert Design
Background
Sir Ronald Fisher introduced the concept of design of experiments (DoE) in the 1920s. This idea encompassed statistical analysis of the project during the planning of experiments rather than after they were completed. His work was extended to include the ‘Quality by Design’ (QbD) concept, emphasizing the importance of planning the entire process to ensure the highest quality. The outlined procedure consists of steps such as recognizing the customer, identifying their needs, translating them into product features, developing the process, and implementing the product features. Employing such a perspective in the pharmaceutical sector, which is strongly process-based and focused on high product quality, took place at the beginning of the new millennium.
Nevertheless, the idea of QbD was proposed by regulatory bodies (such as the U.S. Food and Drug Administration (FDA) and European Medicines Agency (EMA)), recognizing that quality cannot be tested in products, i.e., quality should be built into the design. Today, the DoE is a key statistical tool used to introduce the QbD method in both the research and industrial spheres.1, 2, 3 According to QbD principles, adequate product quality can only be ensured if all critical factors affecting product variability are known and properly controlled. The QbD methods do not focus only on the p-values of the input variables but also on their influence on the response.4
Objectives
The aim of this review was to present the optimization techniques in a concise way.
The application of DoE
The use of DoE reduces the number of experiments performed while increasing the amount of data obtained. In addition, it makes it possible to analyze the mutual influence of different factors on each other and optimize conditions to increase the efficiency of the process.4 It expands the knowledge of the process with minimal consumption of raw materials together with identification of interactions between variables and assessment of their significance. With DoE, it is possible to predict the course of the process throughout the project and demonstrate the cause-and-effect relationship between critical parameters and the response. The model identifies abnormal outliers in the matrices, which allows for their possible elimination.1, 5
The DoE approach has several advantages. It leads to reducing the required resources while maximizing process knowledge. Moreover, DoE efficiently delivers accurate information about the process, the possible interactions between the variables and their impact on the response. Such analysis allows to optimize the quality indicators and makes the process more resilient to changing external conditions.1 The DoE methods are presently widely applied in applicative aspects of polymeric science, including synthesis of polymers and evaluation of drug forms based on the functional polymers.6, 7
Pareto principle
The factors affecting the quality characteristics of the final product follow a general pattern known as the Pareto principle, which indicates that only a small number of factors are responsible for a significant portion of the effect. It is also referred to as the 20:80 rule, which means that 20% of the factors cause 80% of the results. These most influential factors are called critical process parameters, which means process parameters whose variability significantly impacts key product quality attributes. In the context of this standard, critical quality attributes are physical, chemical, biological or microbiological properties, or characteristics that must be controlled to ensure the desired quality. The relationship between critical process parameters (denoted as x) and key quality parameters (denoted as y) is defined by the function y = f(x). This enables the identification of critical process parameters, among many possible ones, and determining optimal process parameter values, leading to improved product performance and ensuring critical quality attribute values are at the appropriate level. The analysis also helps to clarify the mutual interactions between independent variables.1
The applied models
The second-order models that are used in the optimization are Full Factorial Design, Box–Behnken Design, Central Composite Design, and Doehlert Design.8 For Full Factorial Design, the variables are analyzed for different levels in all combinations, which might be time- and material-consuming. The fractional analysis is applied for the remaining 3 models. In this case, the variables are tested for different levels but not in all combinations. That results in a lower number of experiments. The most common are the second-order or quadratic models – they are considered to fit in 95% of cases. The second-order models often detect lack-of-fit error or model mismatch, which makes it possible to determine whether a higher-order model is necessary. The second-order model is satisfactory with properly defined factor limits and appropriate tools. Cubic models are rarely used. In fractional analysis, the higher-order interactions between 3 or more variables are irrelevant.5, 9
Determining the effect of variables on the process under study is possible using analysis of variance (ANOVA), which allows for isolating significant variables and their impact on the response.4 It is a mathematical method that gives an idea of what a significant difference is and what the difference is due to errors due to the application of Fisher’s test (F-test). This test allows the researcher to determine the independent variable’s significance on the dependent response with a well-defined confidence interval (CI) – some authors use CIs of 90%, 95% or 99%.4, 5
A fitted model is a model that describes the relationships between data in such a way that the predictions within the experimental domain are accurate. A mathematical model can be considered accurate when the regression is statistically significant and the lack-of-fit parameter is not. In addition, the regression coefficients R2 and R2adjusted determine the percentage of variation of the dependent variable, which can be explained by their relationship with the independent variables introduced to the model. The closer the value of these coefficients is to 1, the better the regression describes the data statistically. With a statistically significant regression, response surface methodology graph can be used to visualize the optimization of the model.4 When the optimization process depends on multiple variables, the optimal conditions may conflict with each other – the final result should fall within the optimal area in the experimental domain.4
It is recommended that the experiments should be performed in a random order due to the need to obtain a dataset where observed values and errors are independently distributed and randomized. Randomization also helps to average out uncontrolled effects that could be erroneously attributed to one of the analyzed factors.10 Performing replicates at the central point (a point at which the independent variables are at their intermediate levels) allows for a more accurate estimation of the true value of a given parameter while also providing an estimation of the experimental error (so-called pure error) and stabilizing the variance of the predicted response.10, 11
Why is DoE necessary?
Applying DoE helps researchers to reduce the time spent developing new processes, improves the reliability and efficiency of existing processes, as well as helps the researchers to assess the susceptibility to change for tested processes. The statistical analysis, an inseparable part of the optimization, also indicates the most significant factors for the process; it also may suggest which variables should not be taken into consideration.
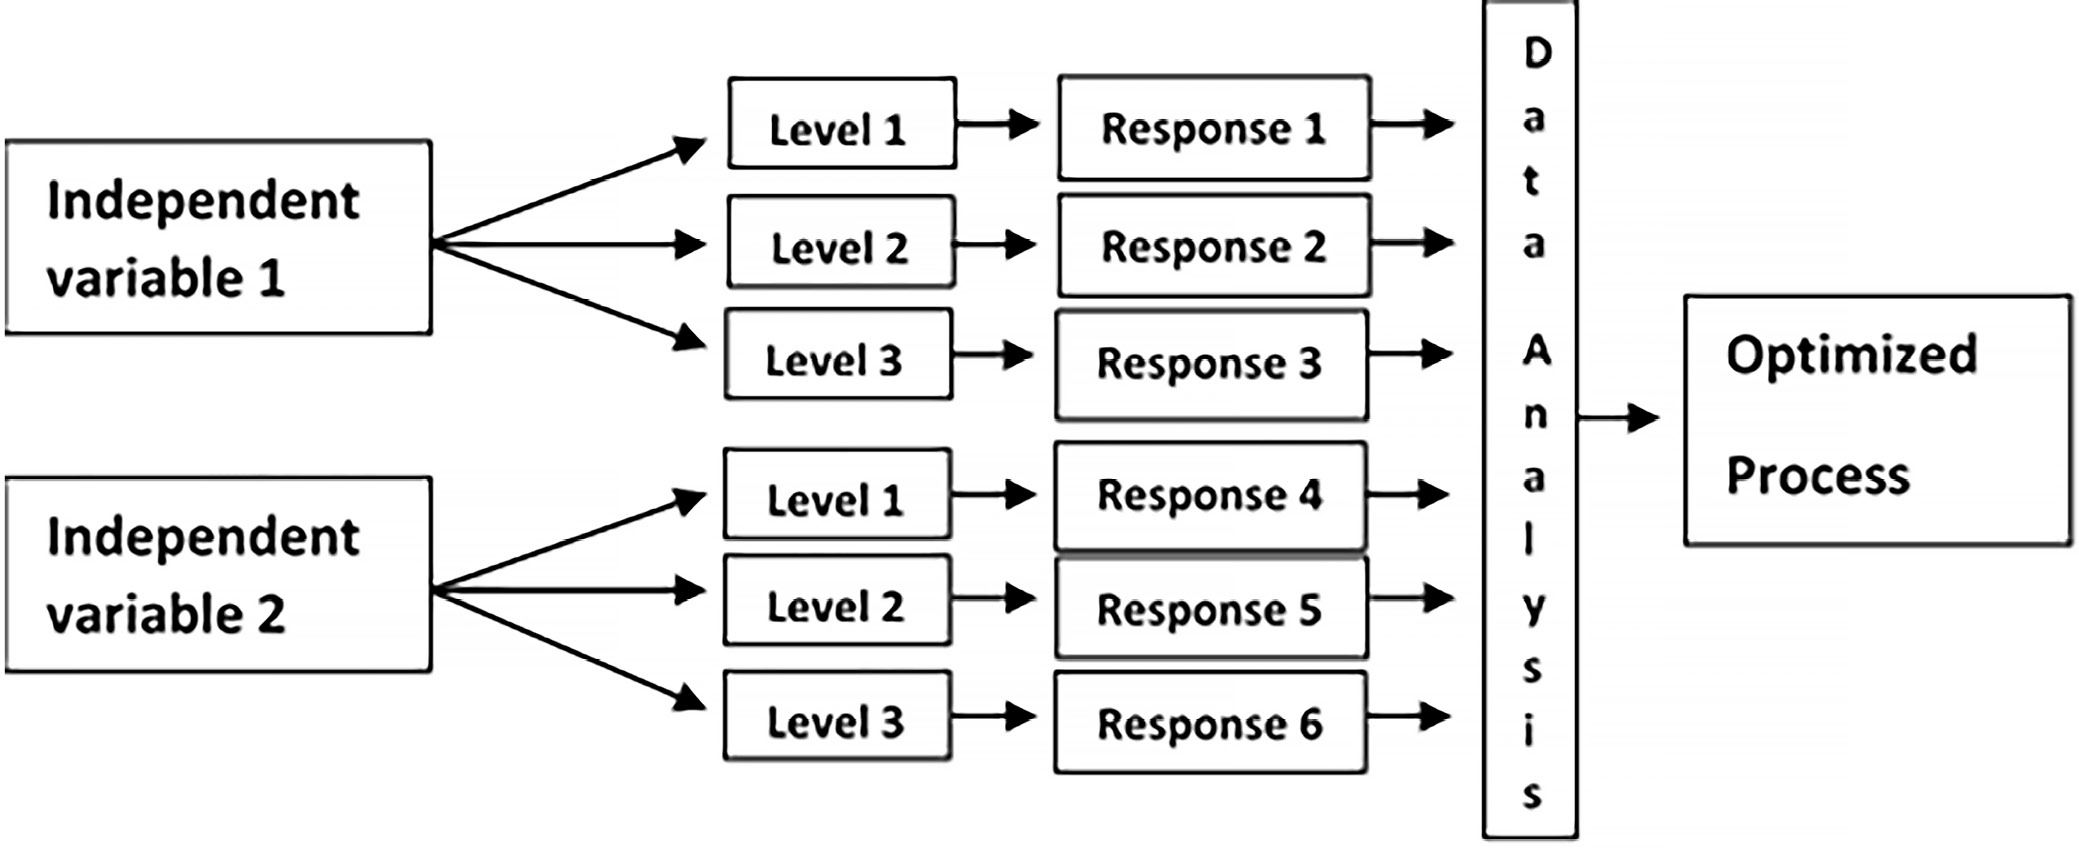
To perform the optimization, it is necessary to define the problem that must be solved, and then to determine the independent variables and their levels. In the latter step, a couple of preliminary experiments are required. Sometimes an experiment conducted for a specific combination of independent variables may fail. The next step is choosing an experimental matrix; Box–Behnken Design, Central Composite Design and Doehlert Design are the most commonly used. Performing the experiments provides the data and allows the researcher to draw the conclusions (Figure 1).
The choice of the proper experimental matrix is a very important issue. In the study by Czyrski and Jarzębski,12 the application of different chemometric models was tested for the optimization of recovery of the analyte. The analysis confirmed that Central Composite Design was the most suitable design for optimizing the recovery of the analyte from a matrix. This design was applied in further studies concerning optimization of recovery with cloud point extraction13 and protein precipitation.14
The validity of the model is confirmed not only with the satisfactory results of statistical parameters, but also with the accuracy of dependent variable prediction with the polynomial equation regression. This regression helps the researchers to predict the response value prior to performing the experiments. However, the limitation factor is that the levels of independent variables for the optimized process should be within the experimental domain.
Artificial neural networks
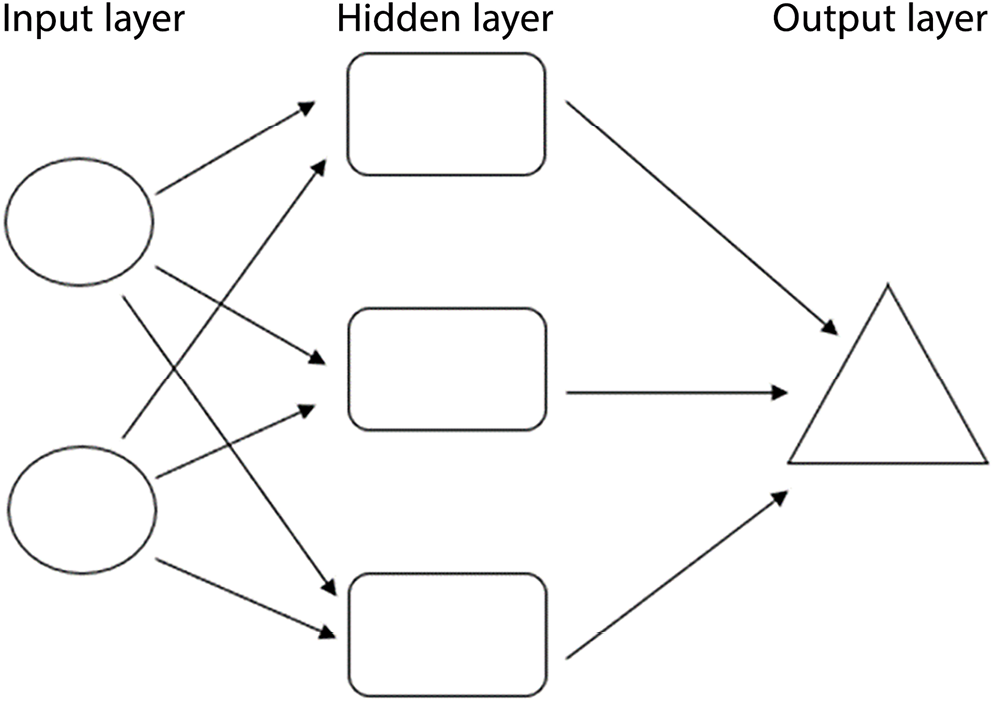
Artificial neural networks (ANN), based on the neural structure of the nervous system, can be considered an alternative tool to optimize the analytical procedure.8 They consist of the 3 following layers: the input, hidden and output (Figure 2).
In the input layer, the independent variables are introduced. For regression analysis, in this layer, the number of neurons equals the number of independent variables. The neurons in this layer transfer the data to the next layer.
In the hidden layer, the number of neurons depends on the operator’s needs. The more neurons are in the layer, the higher computation capacity is achieved. On the other hand, too large number of neurons leads to overtraining, which is undesirable. The hidden layer may consist of 1 or more layers of neurons. In the latter case, the process is called deep learning.
The output layer is connected with the hidden layer, and it shows a result as 1 neuron in the case of the regression model or as a number of possibilities in the case of a classification model. The following activation functions for neurons might be used: linear, sigmoidal, logistic, or hiperbolic tangent. The ANN is trained until the error takes the lowest value – the model may predict the response with satisfactory accuracy – and makes optimizing the nonlinear processes possible. It can be useful in optimizing high-performance liquid chromatography (HPLC) methods. Korany et al.15 applied it in the optimization of the separation of 2 and 3 components in analysis and achieved satisfactory results.
Conclusions
The application of computational techniques makes it possible to evaluate the impact of each variable on the process due to the quantification of the process. Both the DoE and ANN approaches can develop a model that enables the prediction of the result observed for the response of different levels of the independent variables.